Follicular unit analysis module is specifically developed to aid hair transplant surgeons in counting available follicular units and hairs, calculating densities and diameters, recipient and donor scalp surface areas with a correction to an applicable scalp curvature, numbers of grafts, available and in need to achieve desired treatment results, etc. This module can be used both for initial consultation and prior to an actual procedure stages. Each standard “Follicular unit analysis" diagnostic session is composed of “Area sizing", "Measurements", “Summary/Calculator” sections, folowed by final “Conclusion/Print results” step.
First section "Area sizing" is devoted for taking patient's areas of interest global pictures, both for Recipient and Donor areas. These areal picutres can be taken by any non-magnifying digital camera and stored both for general case reviews and their size measurements by recording a name for each area and assigning it a number, marked up on a template, in the applicable table in "Input the area number" and "Enter the comment" fields. And for measurements, a picture of a separate area of interest, the larger in size is the better, shall be taken with a hard millimeter range within given field of view and a soft taylor meter, to be ran accross an area to cover longest possible straight dimension, or with a marked up on scalp two points on a maximum distance in between, which can be measured by a soft meter for a record. First is needed for an actual camera shot scaling, second - for a given scalp curvature coefficient establishment for an area size measurement correction. Then with the first step an actual area of interest can be defined either directly on a scalp during consultation, or by drawn template during preparation for a procedure. Typically, each are is being limited by changes in growing hair density within, scalp curvature, or its boarders, resulting in inability to run soft meter from one side to opposite without folding it. It can be done by choosing for "Area sizing" function and moving a mouse pointer either by defined, or wanted line and right-clicking each time, a line direction has to be changed. And same to be done till you come back to a beinning point, after which a line from red will be changing to yellow color. With second step, an actual camera picture is being scaled by choosing for "Camera scaling" function, marking up with a mouse pointer for a longest visible distance on a hard range by drawing a line in red color and entering its value in the opened table under "Input hard distance, mm" field in order to size an applicable flat surface. And with third step, an actual scalp curvature coefficient is being determined by choosing for "Area scaling" function and marking up with a mouse for a longest visible distance on a soft meter, or between marked up in advance two points, by drawing a line in green color and entering its value in the opened table under "Input soft distance, mm" field to establsih an applicable curvature factor and recalculate for an actual curved area size. All measurements can be displayed in a table format by using "Chart" function.
Second module section "Measurements" is devoted for taking magnified images within each established zone of Recepient and Donor areas of a patient in order to count available hairs and follicular units, thus, determining their densities, as well as measure hair diameters, estabslish their distribution per follicular units and distances between them, thus, determining their mean values. An approach is alsmot identical to measurements in General Trichoscopy section of Trichoscopy diagnostic module, except for follicular units count mode. First, with “Semiautomatic detection mode” function all hairs are being crossed with a mouse cursor, either by one, or in groups, to count them with their diameters established automatically. To do that, position cursor by a side of a hair and, while pressing down left mouse button, cross it with a line perpendicular to hair. You may extend this line to cross more neighboring hairs. As long as the line remains perpendicular to hairs being crossed, their diameters will be measured properly, while maintaining hair density count. When processed, all measured hairs get marked up by two different color strips, either in red for Vellus, or green for Terminal. The darker green color shows for more thick in diameter hairs. Only well contrasted hairs will be detected by this mode and not all of their diameters might be measured correctly either. Some hairs in the field of view may not get detected properly or at all, like very thin, or light shaded hairs and hairs, which get attached side by side to neighboring hairs. In such cases, use “Manual detection mode” with the pressed down “Diameter auto-measurement mode” function, if daimeters may still get measured automatically. It is done by marking a short line approximately in a middle of a shaft. If the hair is still dark enough and well contrasted, a line drawn along a hair shaft will become thicker automatically, coinciding with the thickness of the hair and measuring its diameter. If not, a mouse wheel supposed to be rotated instead to take diameter measurement. After done with these measurements, choose "Follicular unit count mode" function to count them, while establsihing hair distribution per each unit and distances between neighboring units. To do that, place a cursor at the base of a hair unit and press left mouse button as many times, as there are hairs in this unit, mouse button clicks should be performed in quick successions. Program allows to estimate for single, double, triple and quadruple units. After finished, all measurements can be displayed in a table format by using "Chart" function.
Third module section Calculator/Summary" is devoted to gather all measurements results and calculate for numbers of grafts, available and in need to achieve desired treatment results. Data for hair and follicular unit densitites, including separating into single, double, triple and quadruple units, is being presented in counts per one sq.cm and recalculated for a total count per established each Recipient and Donor area size. When each of these main areas is composed of more than one section, all are being summarized to present a total count for a total Recipient and Donor area size. For each of Recepient subareas it is allowed to add a percentage of hairs to increase overall density per sq.cm. for desired density to be achieved. When wanted percentage is selected, by a very same percentage are increasing all other values for follicular unit densities, overall and separately for each of four available unit groups, while providing actual counts for needed and planned units, both per 1 sq.cm and for a full size of applicable Recipient subarea. Same is being done for all Recepient subareas and data for an entire Recepient area is being summarized. As all available follicular unit groups from applicable Donor area, whcih can be comprised of several subareas, have been counted, Program subtracts subsequesntly from each poistion all needed to Recepient area various units and provides results in "Balance units" row. If user notices, that there is not enough of certain units left, or if wants to increase or decrease certain units volume, an originally applied percentage of applicable follicular unit group can be increased, or reduced and, if so, Program will be subsequently increasing or decreasing a neighboring group units. So, different groups of units avalable in Donor area can be optimally distributed for various Recepient area subzones with preferences to providing specific count units to each subzone on more, or less basis, but making sure, that there are available in Donor area speicific units to choose from. Naturally, with each change Program recalculates a total number of follicular units, planned and needed to achieve a desired density, therfore, calculating a total number of graphs to be trasnplanted.
When all finished, a full diagnostic session report can be generated by using "Conlcuison/Print results" function.
Next is a male patient's case with a progressing pattern baldness sample session on preparation for a procedure review:
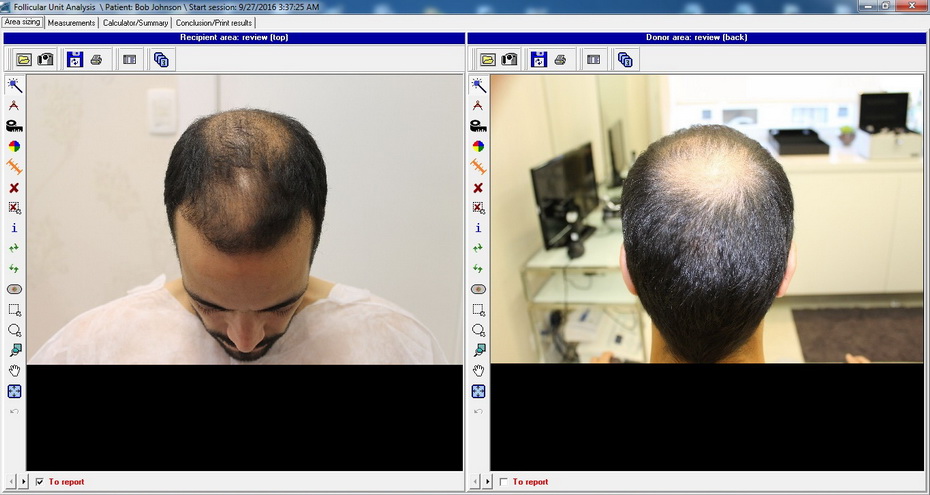
In first module's section for "Area Sizing" global photographs of a patient are being taken, starting with general overview pictures to be kept on a patient's file, which are not limited in amount and all have to be assigned to area "0" with an appropriate description, when saving, in order not to be included for areal calculations.
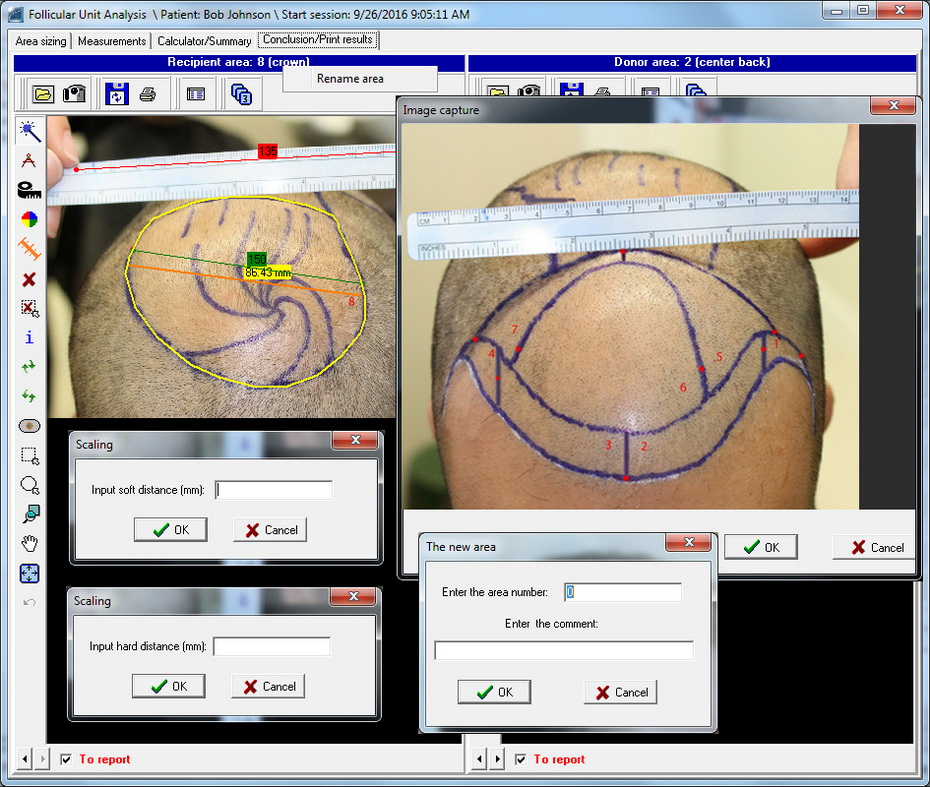
After shaving, a template is being applied to scalp, separating it into subareas with different growing hair densities and/or if there is no capability to run a soft taylor meter from one to another end of it for a scalp curvature coefficient calculations. These oposite points are being marked up and each subarea gets its own number assigned. A picture is being taken with a hard mm range visible within it for an actual camera scaling. For some better measurements accuracy, it is recommended to obtain such areal pictures of each subarea separately, although, a larger picuture, including several subareas may be taken, as well. When taking picture, enter its area number and a desciption for record. After sizing subarea, mark up and enter in mm a longest visible "hard distance" on a hard mm range, then mark up "soft distance" on picture, measure it with a soft meter on a scalp and enter its value in mm. After finished, proceed to next subarea with identical steps.
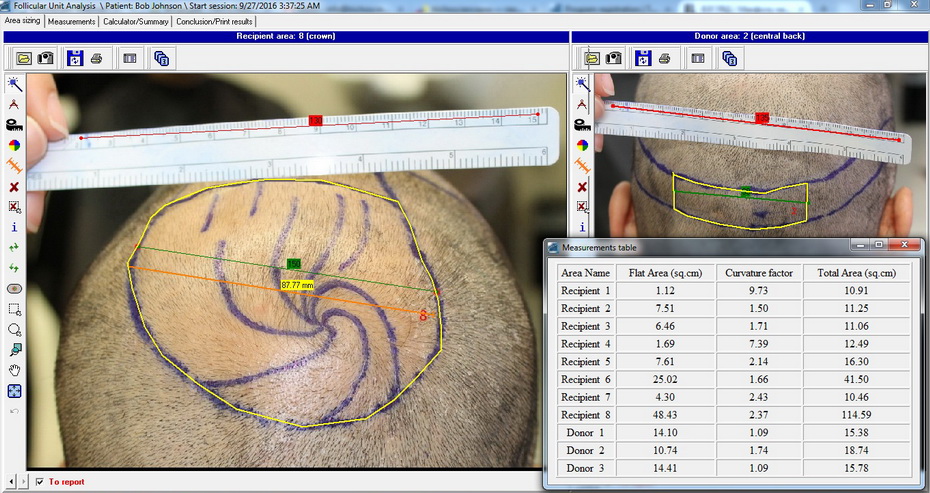
After obtaining measurements of all subareas of Recepient area in left window and Donor area in right window, results can be previewed in summary table.
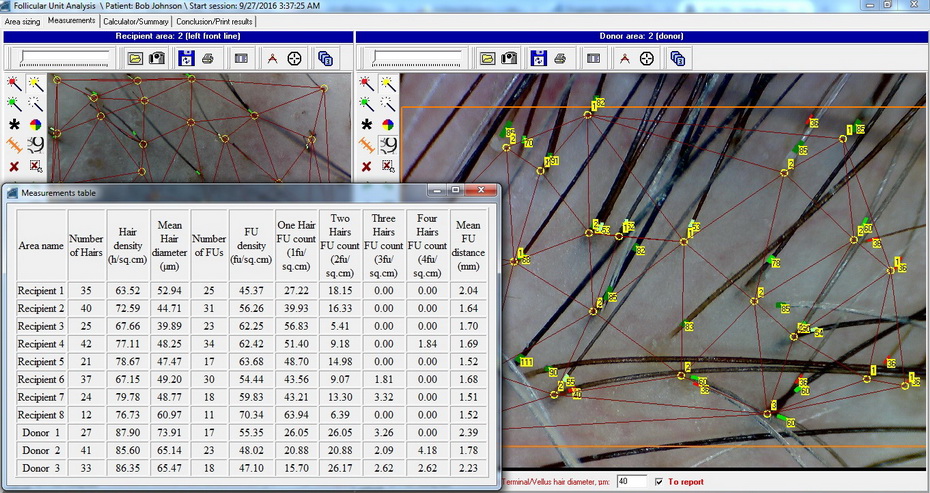
In second module's section for "Measurements" microscopic photographs of each subarea are being taken for hair density counts with their diameters measured, as well as follicular unit counts with distances between neighboring units measured. Each subarea is being recorded under its assigned number and results can be previewed in summary table.
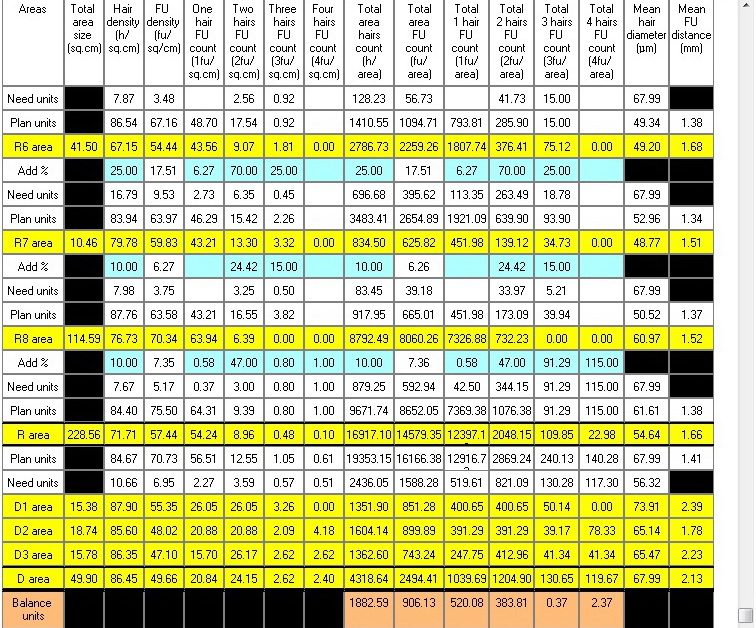
All obtained in first two sections results are being imported into third module's section "Calcultor/Summary", where this data can be analysed and adjusted according to planned procedure needs. After finihed, a complete diagnostic session report can be formed in this module's fourth section "Conclusion/Print results".
This example presented shows FUT technique for Donor Area. Same approach can be taken, if FUE technique is used, large Donor areas limited to sectioned out two or four subareas, are being measured identically and then the total numbers diveded, say, by three, if every third "plug" is taken out. etc. Thsi way a total available hairs and units count is being established. And for patietns in advanced balding stages for combined FUT/FUE therapy, a template should be drawn establishing all subzones for Donor Area, then with first step FUT strip shall be reviewed, and with second - 4 or 8 FUE areas to be covered,
Next is a female patient's case at a beginning stages of pattern baldness sample session for an initial consultation for a procedure review:
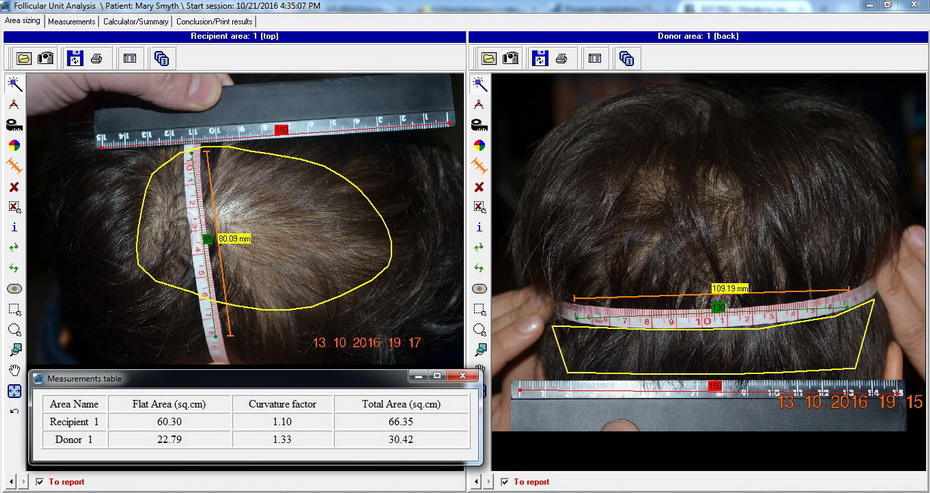
In first module's section for "Area Sizing" global photographs of a patient's Recipient and Donor areas are being taken with a hard mm range visible within for an actual camera scaling and soft taylor meter ran across for scalp curvature factor, when sizing an area calculations. When taking a picture, enter its area number and a desciption for record. After sizing an area, mark up and enter in mm a longest visible "hard distance" on a hard mm range, then mark up longest visible "soft distance" on soft meter and enter its value in mm. After obtaining measurements of all subareas of Recepient area in left window and Donor area in right window, results can be previewed in summary table.
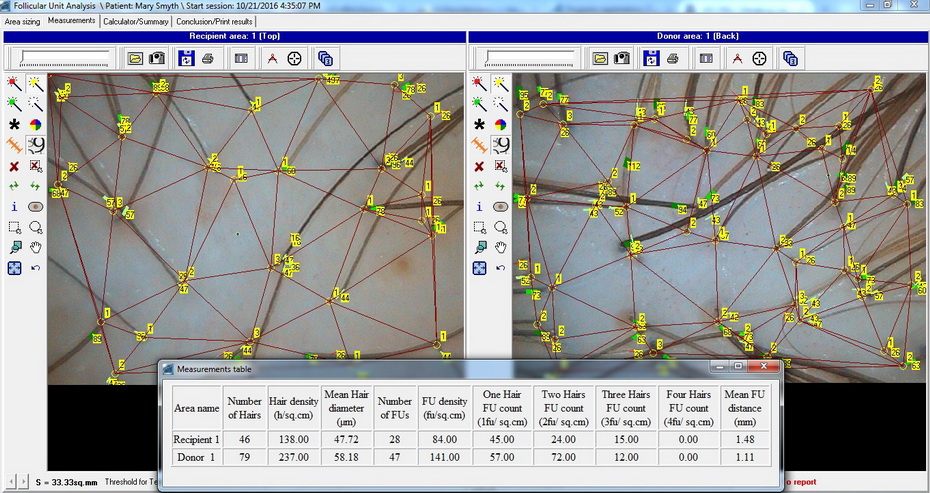
In second module's section for "Measurements" microscopic photographs of each subarea are being taken for hair density counts with their diameters measured, as well as follicular unit counts with distances between neighboring units measured. Each subarea is being recorded under its assigned number and results can be previewed in summary table.
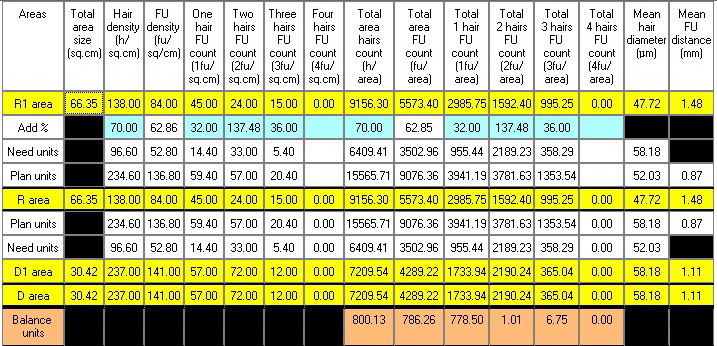
All obtained in first two sections results are being imported into third module's section "Calcultor/Summary", where this data can be analysed and adjusted according to planned procedure needs by same approach, as described in first case above. After finihed, a complete diagnostic session report can be formed in module's fourth section "Conclusion/Print results".